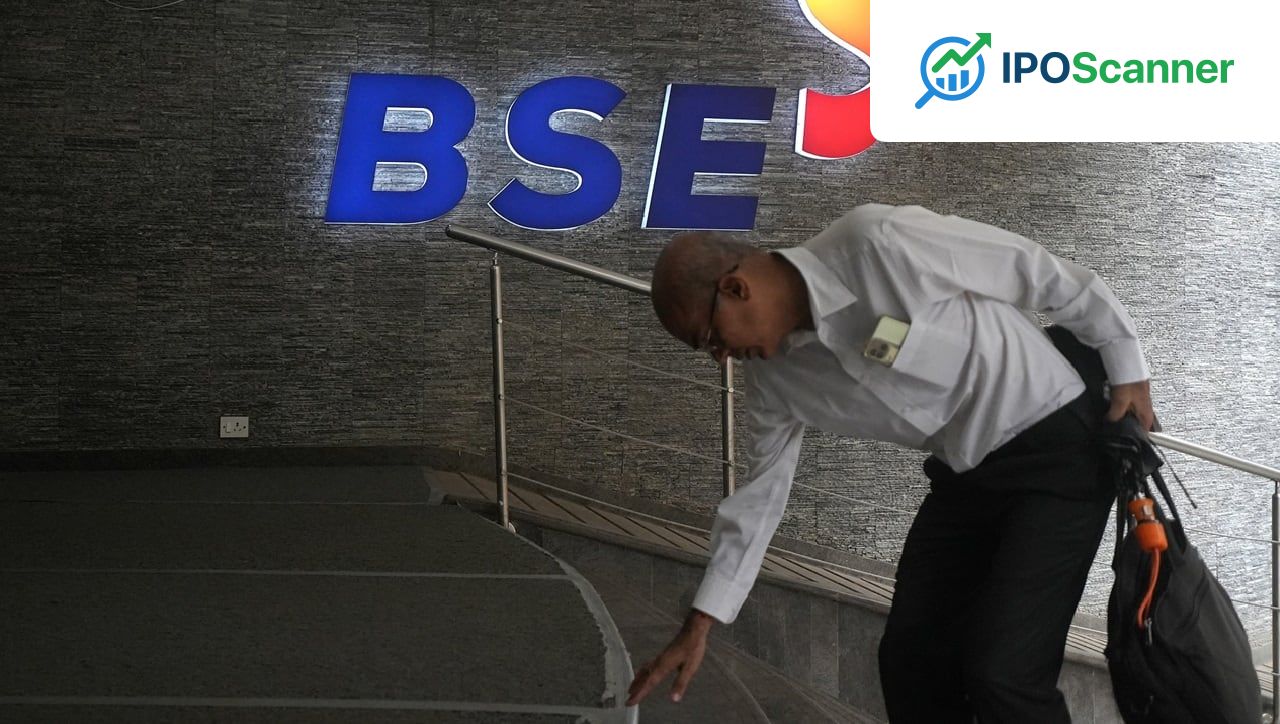
April Ceasefire Lifts BSE SMID 400 Back to Pre-Conflict Level of 12,000
BSE SMID 400 Index Returns to Pre-US-Iran War Level, but Analysts Expect Range-Bound Trading
The April ceasefire has lifted the BSE SMID 400 index back to its pre-US-Iran war level of around 12,000. However, analysts do not expect the relief rally to break the index out of the two-year trading range that has held it between 11,000 and 13,000.
Valuations on the index are still considered rich, with the index trading at roughly four times price-to-book. This is a 20 percent premium to its 10-year average and close to three times the levels that have marked past buying opportunities. SMIDs also sit at a 40 percent premium to the Nifty, twice the long-term norm, and at a similar premium to US small-caps even though their growth edge has narrowed sharply.
Comparison of Index Valuations
Read also: IKS Health Acquires TruBridge Inc for Up to $565 Million
| Index | Price-to-Book Ratio | Premium to 10-Year Average |
|---|---|---|
| BSE SMID 400 | 4 | 20% |
| Nifty | 2.4 | 10% |
| US Small-Caps | 4 | 20% |
Without a fresh policy stimulus like the one in 2020 or the pent-up demand surge of 2022, the earnings rebound after the supply shock will be muted. Household and MSME incomes remain weak, and credit growth is mostly in gold loans and substitutes rather than real activity. As a result, Nuvama expects the consensus forecast of 22 percent EPS CAGR for FY26-28 to disappoint.
Kusha Gupta, director at SKG Investment and Advisory, takes an even sharper view on the structural issues. She points out that the derating in SMIDs began well before the US-Iran conflict. The index had already peaked in September 2024 and slipped into the current range months earlier. In 2024, small-caps returned 29 percent and mid-caps 26 percent, far outpacing earnings growth and creating a vulnerability that was already in place.
The BSE 400 MidSmallCap Index trades at 4.83 times price-to-book, a 60 percent premium to the 10-year median and roughly three times bottom-cycle levels of 1.5-2 times. One-year forward EPS has been flat for two years amid continuous downgrades, and the earnings yield stands at just 4 percent against India’s 7 percent 10-year bond yield.
Read also: IKS Health Acquires TruBridge for $565 Million to Expand US Healthcare Presence
Manish Sonthalia, director and CIO at Emkay Investment Managers, agrees that the conflict was not the root cause of the derating. SMIDs had already started correcting after peaking in July 2025. Liquidity had been shifting away from small- and mid-caps toward large-caps and primary markets, and the broader market had turned narrow. The Nifty itself has delivered almost zero returns over the past two years.
Chirag Muni of Anand Rathi Wealth sees the war’s main effects in two areas: the spike in oil from around 69 dollars to nearly 120 dollars a barrel and the tightening of liquidity from fresh FII outflows. SMIDs felt both pressures more keenly because of thinner balance sheets and higher sensitivity to risk-off moves. Yet the quick bounce after the ceasefire shows that much of the near-term disruption was already priced in.
Margin pressure from US-Iran conflict will show up more clearly in first-quarter FY27 numbers, particularly in sectors with heavy energy or import exposure such as chemicals, petrochemicals, tyres, cement, aviation, paints, pipes, tiles, hospitality, EVs, metals, power, and certain auto ancillaries.
Technically, a genuine breakout still looks distant. Previous highs in the mid- and small-cap space sit roughly 10 percent above current levels. Analysts expect SMIDs to stay range-bound for now, with longer-term direction depending on company-specific fundamentals once input costs settle.
While SMID earnings growth has held up better than large-caps on a trailing 12-month basis, and India’s corporate profit pool has broadened well beyond the Nifty 50, most analysts feel current valuations leave little room for error. For the moment, the market is in wait-and-watch mode, with investors turning selective and focusing on quality names in consumption and exports that can ride out any lingering energy uncertainty.
Investor Takeaway
Investors should be cautious of the relief rally and not expect the index to break out of its two-year trading range.
More in Market

IKS Health Acquires TruBridge Inc for Up to $565 Million
IKS Health Acquires TruBridge for $565 Million to Expand US Healthcare Presence

Balrampur Chini to Raise Rs 450 Crore Equity Fund for Lactose Derivatives Plant Expansion